#IndiaTrade #IndiaExports #May2025Exports #Exportgrowth
New Delhi: The cumulative value of merchandise exports during April-May 2025 was US$ 77.19 Billion, as compared to US$ 74.89 Billion during April-May 2024, registering a positive growth of 3.07%.
The cumulative Non-Petroleum exports in April-May 2025 valued at US$ 64.25 Billion registered an increase of 7.53% as compared to US$ 59.75 Billion in April-May 2024.
Major drivers of merchandise exports growth in May 2025 include Electronic Goods, Organic & Inorganic Chemicals, Drugs & Pharmaceuticals, Marine Products and RMG of all Textiles.
Electronic Goods exports increased by 54.10 % from US$ 2.97 Billion in May 2024 to US$ 4.57 Billion in May 2025.
Organic & Inorganic Chemicals exports increased by 16.00 % from US$ 2.31 Billion in May 2024 to US$ 2.68 Billion in May 2025.
Drugs & Pharmaceuticals exports increased by 7.38 % from US$ 2.31 Billion in May 2024 to US$ 2.48 Billion in May 2025.
Marine Products exports increased by 26.79 % from US$ 0.58 Billion in May 2024 to US$ 0.73 Billion in May 2025.
RMG of all Textiles exports increased by 11.35 % from US$ 1.36 Billion in May 2024 to US$ 1.51 Billion in May 2025.
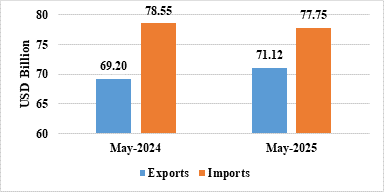
- India’s total exports (Merchandise and Services combined) for May 2025* is estimated at US$ 71.12 Billion, registering a positive growth of 2.77 percent vis-à-vis May 2024. Total imports (Merchandise and Services combined) for May 2025* is estimated at US$ 77.75 Billion, registering a negative growth of (-) 1.02 percent vis-à-vis May 2024.
Table 1: Trade during May 2025*
| May 2025
(US$ Billion) |
May 2024
(US$ Billion) |
||
| Merchandise | Exports | 38.73 | 39.59 |
| Imports | 60.61 | 61.68 | |
| Services* | Exports | 32.39 | 29.61 |
| Imports | 17.14 | 16.88 | |
| Total Trade
(Merchandise +Services) * |
Exports | 71.12 | 69.20 |
| Imports | 77.75 | 78.55 | |
| Trade Balance | -6.62 | -9.35 |
* Note: The latest data for services sector released by RBI is for April 2025. The data for May 2025 is an estimation, which will be revised based on RBI’s subsequent release.
Fig 1: Total Trade during May 2025*

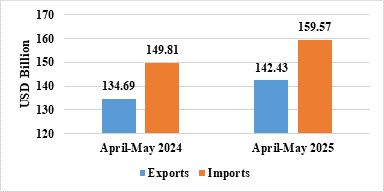
- India’s total exports during April-May 2025* is estimated at US$ 142.43 Billion registering a positive growth of 5.75 percent. Total imports during April-May 2025* is estimated at US$ 159.57 Billion registering a growth of 6.52 percent.
Table 2: Trade during April-May 2025*
| April-May 2025
(US$ Billion) |
April-May 2024
(US$ Billion) |
||
| Merchandise | Exports | 77.19 | 74.89 |
| Imports | 125.52 | 116.16 | |
| Services* | Exports | 65.24 | 59.79 |
| Imports | 34.05 | 33.64 | |
| Total Trade
(Merchandise +Services) * |
Exports | 142.43 | 134.69 |
| Imports | 159.57 | 149.81 | |
| Trade Balance | -17.14 | -15.12 |
Fig 2: Total Trade during April-May 2025*
MERCHANDISE TRADE
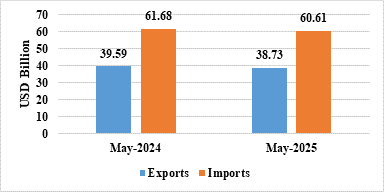
- Merchandise exports during May 2025 were US$ 38.73 Billion as compared to US$ 39.59 Billion in May 2024.
- Merchandise imports during May 2025 were US$ 60.61 Billion as compared to US$ 61.68 Billion in May 2024.
Fig 3: Merchandise Trade during May 2025
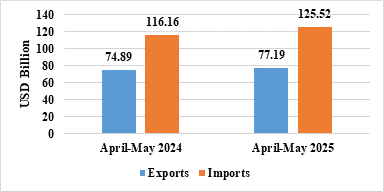
- Merchandise exports during April-May 2025 were US$ 77.19 Billion as compared to US$ 74.89 Billion during April-May 2024.
- Merchandise imports during April-May 2025 were US$ 125.52 Billion as compared to US$ 116.16 Billion during April-May 2024.
- Merchandise trade deficit during April-May 2025 was US$ 48.33 Billion as compared to US$ 41.27 Billion during April-May 2024.
Fig 4: Merchandise Trade during April-May 2025
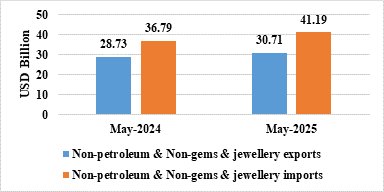
- Non-petroleum and non-gems & jewellery exports in May 2025 were US$ 30.71 Billion compared to US$ 28.73 Billion in May 2024.
- Non-petroleum, non-gems & jewellery (gold, silver & precious metals) imports in May 2025 were US$ 41.19 Billion compared to US$ 36.79 Billion in May 2024.
Table 3: Trade excluding Petroleum and Gems & Jewellery during May 2025
May 2025(US$ Billion) |
May 2024
(US$ Billion) |
|
| Non- petroleum exports | 33.09 | 31.49 |
| Non- petroleum imports | 45.86 | 41.70 |
| Non-petroleum & Non-Gems & Jewellery exports | 30.71 | 28.73 |
| Non-petroleum & Non-Gems & Jewellery imports | 41.19 | 36.79 |
Note: Gems & Jewellery Imports include Gold, Silver & Pearls, precious & Semi-precious stones
Fig 5: Trade excluding Petroleum and Gems & Jewellery during May 2025
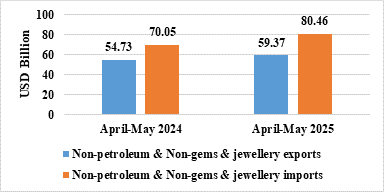
- Non-petroleum and non-gems & jewellery exports in April-May 2025 were US$ 59.37 Billion, compared to US$ 54.73 Billion in April-May 2024.
- Non-petroleum, non-gems & jewellery (gold, silver & precious metals) imports in April-May 2025 were US$ 80.46 Billion, compared to US$ 70.05 Billion in April-May 2024.
Table 4: Trade excluding Petroleum and Gems & Jewellery during April-May 2025
April-May 2025(US$ Billion) |
April-May 2024
(US$ Billion) |
|
| Non- petroleum exports | 64.25 | 59.75 |
| Non- petroleum imports | 90.06 | 79.70 |
| Non-petroleum & Non Gems & Jewellery exports | 59.37 | 54.73 |
| Non-petroleum & Non Gems & Jewellery imports | 80.46 | 70.05 |
Note: Gems & Jewellery Imports include Gold, Silver & Pearls, precious & Semi-precious stones
Fig 6: Trade excluding Petroleum and Gems & Jewellery during April-May 2025
SERVICES TRADE
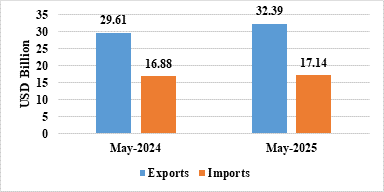
- The estimated value of services export for May 2025* is US$ 32.39 Billion as compared to US$ 29.61 Billion in May 2024.
- The estimated value of services imports for May 2025* is US$ 17.14 Billion as compared to US$ 16.88 Billion in May 2024.
Fig 7: Services Trade during May 2025*
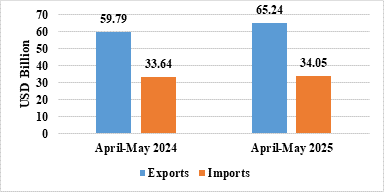
- The estimated value of service exports during April-May 2025* is US$ 65.24 Billion as compared to US$ 59.79 Billion in April-May 2024.
- The estimated value of service imports during April-May 2025* is US$ 34.05 Billion as compared to US$ 33.64 Billion in April-May 2024.
- The services trade surplus for April-May 2025* is US$ 31.19 Billion as compared to US$ 26.15 Billion in April-May 2024.
Fig 8: Services Trade during April-May 2025*
- Exports of Electronic Goods (54.1%), Marine Products (26.79%), Tobacco (22.69%), Meat, Dairy & Poultry Products (16.87%), Organic & Inorganic Chemicals (16%), Mica, Coal & Other Ores, Minerals Including Processed Minerals (11.65%), Rmg Of All Textiles (11.35%), Spices (11.19%), Other Cereals (9.64%), Jute Mfg. Including Floor Covering (9.5%), Coffee (8.18%), Drugs & Pharmaceuticals (7.38%), Leather & Leather Products (6.89%), Fruits & Vegetables (2.56%), Tea (2.3%), Ceramic Products & Glassware (2.27%), Carpet (1%) record positive growth during May 2025 over the corresponding month of last year.
- Imports of Pulses (-51.89%), Transport Equipment (-28.23%), Fertilisers, Crude & Manufactured (-26.64%), Petroleum, Crude & Products (-26.14%), Newsprint (-20.57%), Coal, Coke & Briquettes, Etc. (-19.37%), Pearls, Precious & Semi-Precious Stones (-18.51%), Metaliferrous Ores & Other Minerals (-13.53%), Gold (-12.6%), Vegetable Oil (-3.61%) record negative growth during May 2025 over the corresponding month of last year.
- Services exports is estimated to grow by 9.11 percent during April-May 2025* over April-May 2024.
- Top 5 export destinations, in terms of change in value, exhibiting positive growth in May 2025 vis a vis May 2024 are U S A (16.93%), China P Rp (25.04%), Australia (35.36%), Russia (48.11%), and Germany (17.05%).
- Top 5 export destinations, in terms of change in value, exhibiting positive growth in April-May 2025 vis a vis April-May 2024 are U S A (21.78%), U Arab Emts (12.31%), Australia (50.76%), China P Rp (18.75%) and Oman (40.94%).
- Top 5 import sources, in terms of change in value, exhibiting growth in May 2025 vis a vis May 2024 are China P Rp (21.61%), U Arab Emts (27.64%), Nigeria (89.56%), Hong Kong (29.3%), and Japan (24.32%).
- Top 5 import sources, in terms of change in value, exhibiting growth in April-May 2025 vis a vis April-May 2024 are U Arab Emts (52.08%), China P Rp (24.23%), U S A (25.8%), Ireland (287.99%) and Hong Kong (38.5%).